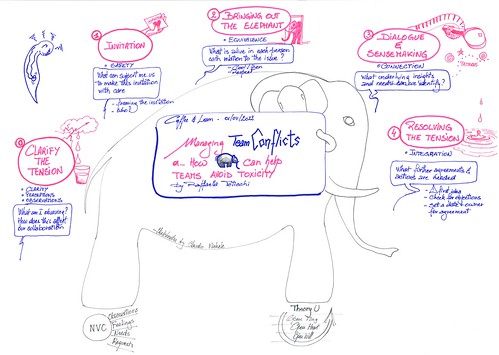
Conflict and tension are part of (work) life and can become toxic if ignored. If we address them with care, wisdom can emerge and we can foster safety and trust in our teams.
Based on non-violent communication (NVC) and Theory U, Raffaella Toticchi explained us the 4+1 steps to have the needed conversations in our teams to finally resolve the tension:
Clarify the tension, perceptions and observations
Invite (with care) to have a conversation
Bring out the elephant (in the room)
Go deeper in the di-alogue and sense-making
Resolve the tension and look at further agreements and actions
The talk was part of the “Coffee and Learn” initiative organised by the One-Stop-shop in DG JRC, European Commission.
To best support the EC’s new HR strategy, announced by Gertrud Ingestad Director-General for Human Resources at European Commission, a community of HR professionals has been constituted.
I had the privilege of attending their first meetings where they discussed how to translate their vision into practical ways of convening, collaborating and being user centric. A solid team of expert colleagues guides the first steps of this community of practice.
It’s an emotion to announce that this is the last episode that I produce of the “Stories from the regions” series. After 42 stories, I’ll leave the production to my team who will continue it in DG REGIO, the Regional and Urban Policy department of the European Commission.
I imagined this series a couple of years ago, before the pandemic, as a pure internal communication initiative. My aim was to make my colleagues aware of what they contribute to every day with their work on EU funds and make them proud of it. This is how I asked them to become mobile journalists for me:
To collect with a normal mobile phone the human stories of the beneficiaries of EU funds in the field during their professional trips to the regions of Europe.
To record testimonials on how co-funded projects have had an impact on people’s lives.
With the trainees who were directly involved in the initiative and the colleagues, my team created these short videos from the collected material on the ground. Often with extremely variable quality because none of my colleagues are cameramen or journalists.
The goal was not perfection, but the authenticity of the testimonies in the stories.
Over time, the videos proved to carry a message that could also interest people outside our offices, and so we began to publish the video stories on Youtube and share them on the @EUinmyRegion social networks. The success of the episodes on social media is still modest, but the primary objective is not there. The series is primarily an internal communication tool and as such we have mobilised dozens of colleagues around it. They derived recognition, pride for what they do, and were able to better understand the purpose of their work.
All of this would never have been possible without the unconditional support and help of Agnès MONFRET who believed in the series from the start. She encouraged me, and pushed me, to make it evolve. Merci infiniment Agnès! The support of Marc Lemaître, Director-General in DG REGIO, with his motto “communication is everyone’s business” was also an important element in involving our colleagues in the initiative. Thank you Marc.
And finally, A huge thank you and a special mention for my colleague Marc Rodrigues, my Steven Spielberg! I wish you’ll the best and to continue the series. I will continue to follow you closely.
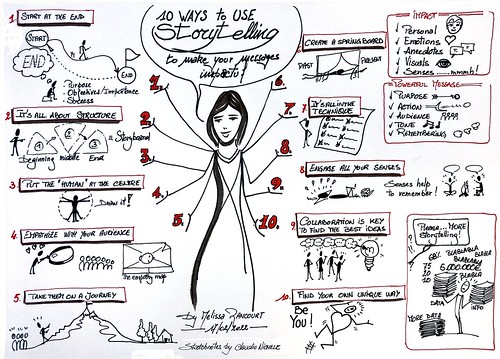
My sketchnotes of “10 ways to use Storytelling to make your messages impactful”, an online workshop by Melissa Rancourt for the INFORM EU communicators network.
All tips are important but N°10 is the most important, according to me.
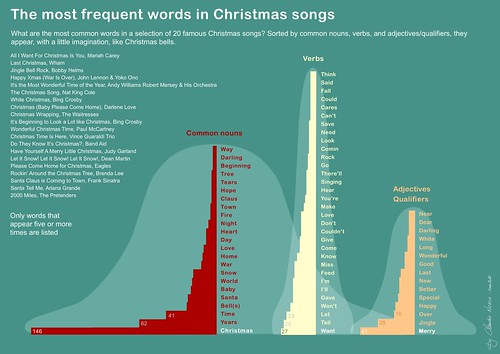
Did you enjoy listening to Christmas songs lately? I did, and I wondered what are the words that come up most often. A few online tools and Procreate and here are the Christmas bells of the most frequent words in Christmas songs. An imperfect data visualisation.
How EU policymakers can navigate the new societal and political landscape of complex challenges, growing polarisation of groups of citizens, and conflicting opinions?
A report by the EU Science, Research and Innovation says that science alone doesn’t move the policy debate or citizens behaviours. Rather, policymakers should understand the EU citizens’ values and identities, their differences inside a country and among countries, how identities influence values, how being member of different groups (tribes) colour people’s opinions and biases.
This understanding helps to better see what is desired by citizens, what is important for them, and finally to improve policymaking and regain trust in democracy. At the end of his presentation of the report, Mario Scharfbillig mentioned a toolkit to integrate values and identity in policymaking: heightened understanding, co-creation, and communication.