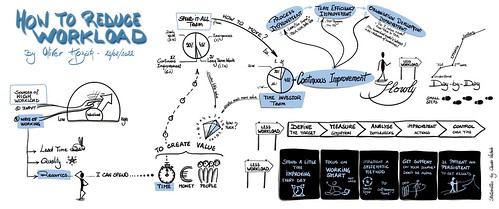
My takeaway from conversations that I captured visually
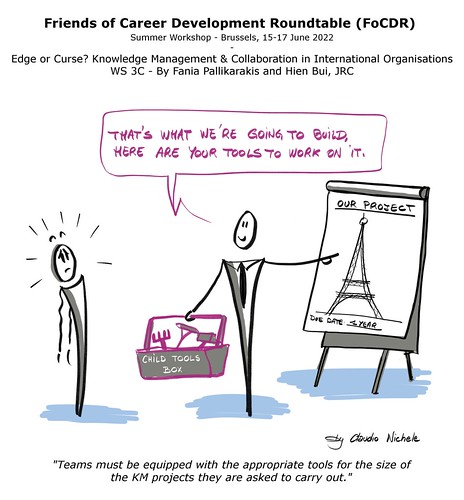
Our brain has great difficulty understanding a complex system with only words. A visual can bring clarity about the complexity and eventually show that what appears to be complex is just complicated.
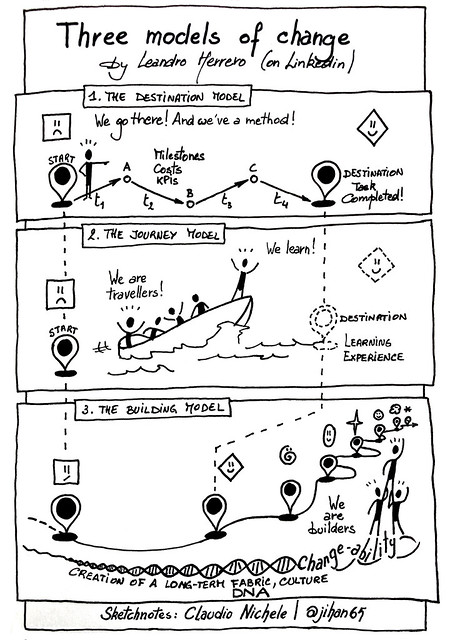
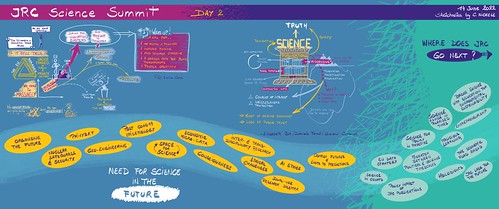
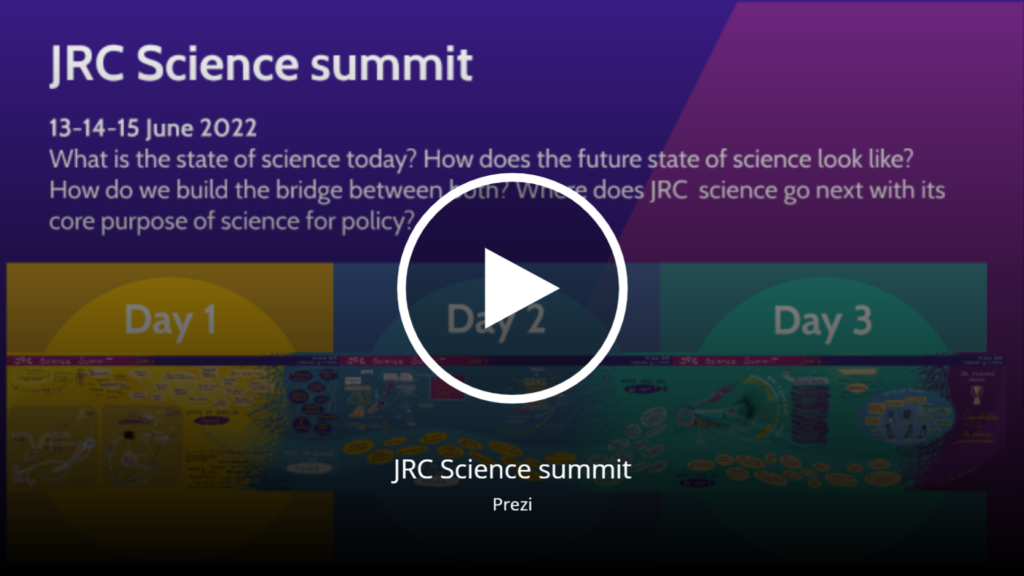
Over 200 colleagues from across the JRC, the European Commission’s science and knowledge department, met for the launch of their future new transversal working structures, the JRC scientific portfolios. The goal was to engage and discuss around the journey they are about to embark upon together. As with any departure, there was excitement but also some fear sometimes in the face of the unknown.
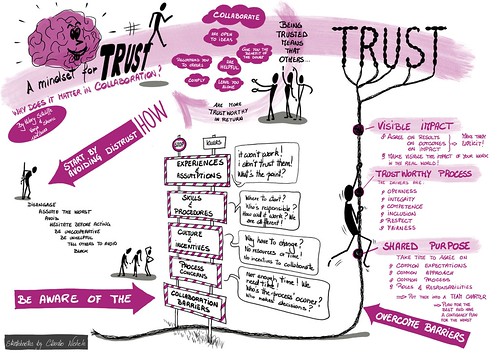
During a large World Café exercise, colleagues discussed the many outstanding issues, roles and responsibilities, collaboration, resources, to name but a few. At the end, each conversation table shared their main conclusions with everyone. The large number of points, open questions, as well as the numerous interlinkages, made it difficult not to qualify the portfolios system as complex.
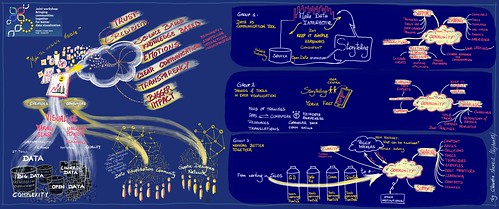
My task was to take visual notes of the conclusions, the typical graphic harvesting of a World Café. Because it was too much, too dense and fast, I just noted on post-its the key words and few arrows. Afterwards I put on a large paper a first draft of all of that. Only then did I reorder the points and the connections to create a mind-map on my iPad.
In his report after the event in which he used my visuals, Stephen Quest, the JRC Director-General, said “the portfolios must not become another layer of complexity. Rather, we need to use them to help navigate our complexity.” I am happy and proud to have been able to bring clarity to this apparent complexity with my visual, and I hope I have reduced it to something only complicated.

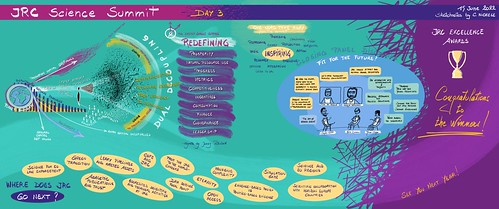
Two other graphic recordings of the presentations the day before:


And the video to illustrate my visual thinking process in three steps: post-its > draft on large paper > mind map on iPad.