In the article that I co-wrote with my colleague and manager Agnès Monfret, we explain how we adapted our way of communicating internally and externally when the pandemic hit our habits, our ways of working and thinking.
Once again, the use of handmade drawings greatly supported the messages, and brought that touch of humanity necessary in a world of communication and collaboration that has become entirely digital.
The original article was published on TerritoriALL, the EPSON magazine (page66). Thank you Agnès for this collaboration and for the work done together.
17/11/2020 – La deuxième vague de contaminations au virus COVID-19 en Belgique a atteint son apogée, enfin, et les différents indicateurs sont tous à la baisse. Il faut espérer que cette inversion de tendance se poursuive.
Les données du site sciensano.be[1] montrent que la deuxième vague a atteint des pics plus élevés que la première du printemps 2020. Les personnes admises à l’hôpital pour cause de COVID-19 par jour ainsi que les patients en soins intensifs ont été plus nombreux, mais heureusement il y a eu moins de décès par jour.
La décroissance est certainement attribuable aux changements de comportement des personnes en société, en famille, au travail; changements qui ont été eux-mêmes influencés/imposés par les mesures prises par les dirigeants politiques [2]. Ce sont les décisions politiques, comme celle de mettre la population en confinement, qui conditionnent le plus nos comportements et nos agissements quotidiens, bien plus que tout autre facteur (la connaissance, les croyances, les relations,…). C’est pourquoi je me suis posé la question est-ce que nos dirigeants ont pris les bonnes décisions au bon moment pour tenter de contenir la deuxième vague?
Intuitivement, je pense que nos dirigeants n’ont pas pris les décisions au bon moment avant et pendant la deuxième vague, et que des morts auraient pu être évités. Pour confirmer ou pas mon intuition, j’ai décidé de comparer les deux vagues et de coller dessus le moment où les importantes décisions politiques ont été prises.
Les décisions politiques
D’abord, le système décisionnel pour tout ce qui touche à la santé est compliqué en Belgique, très compliqué. Les compétences de santé y sont éclatées entre les différents ministres des gouvernements du fédéral, des régions et/ou communautés. Ce que l’on appelle la lasagne institutionnelle belge est en fait un spaghetti (un foutoir?). J’ai tenté de l’illustrer sans y parvenir:
Les différents gouvernements ont pris des mesures chacun à leur tour et ont donné autant de conférences de presse pour les communiquer. C’est ainsi qu’on a eu droit à un triste festival de conférences de presse au mois d’octobre: d’abord le gouvernement fédéral avec un renforcement des mesures le 6/10, puis des mesures plus dures le 16/10, puis des mesures encore plus strictes le 23/10 au matin, les gouvernements de Wallonie et de la Fédération Wallonie-Bruxelles adoptent des mesures plus strictes ce même 23/10 après-midi, la région de Bruxelles prend ses mesures un jour après le 24/10, le gouvernement flamand adopte ses mesures le 27/10, et finalement le gouvernement fédéral décrète le deuxième confinement le 28/10. Le manque de coordination a été… flagrant. Cela est venu s’ajouter à une communication souvent confuse. Un problème rencontré depuis la première vague, avec par exemple le port du masque conseillé, puis rendu obligatoire, pas partout ici mais partout la-bas, tout le temps ou à certains moments selon la région, puis à nouveau conseillé puis à nouveau obligatoire selon la région. Même chose pour les cours à distance dans l’enseignement, la fermeture des commerces, les horaires du couvre-feu, etc.
J’ai placé les événements principaux qui se sont succédés en Belgique sur une ligne du temps (impossible de tous les mettre, mais indiquez-moi si quelque chose d’important manque):
Les deux vagues
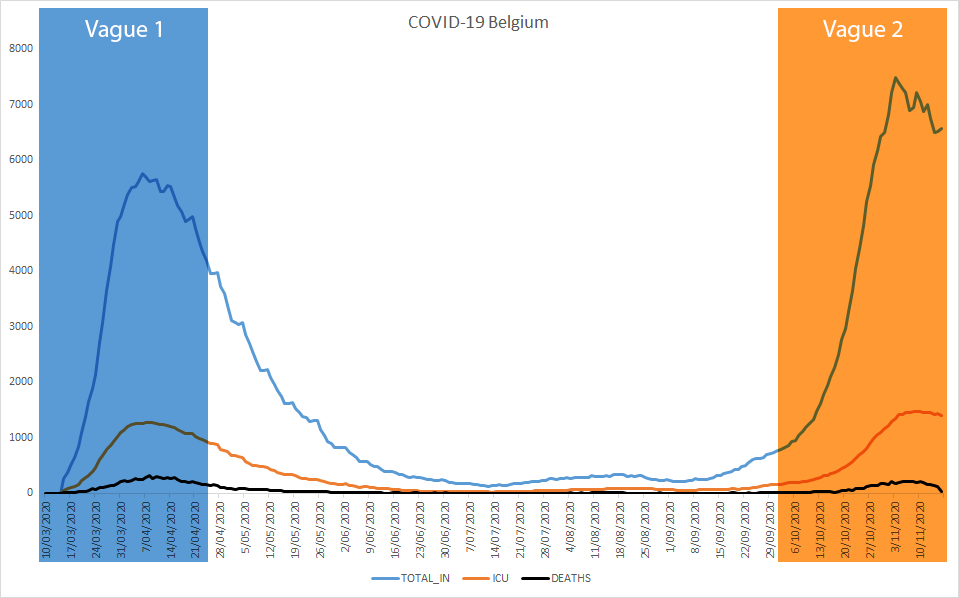
Pour comparer les deux vagues, je me suis limité à 3 indicateurs journaliers avec 1) le nombre d’admissions à l’hôpital, 2) le nombre de patients en soins intensifs, et 3) le nombre de morts. Ce sont les seuls indicateurs qui soient assez comparables entre les deux vagues. Les autres indicateurs comme le nombre de cas et celui des tests effectués ont trop changé au cours du temps selon la stratégie de testing adoptée.
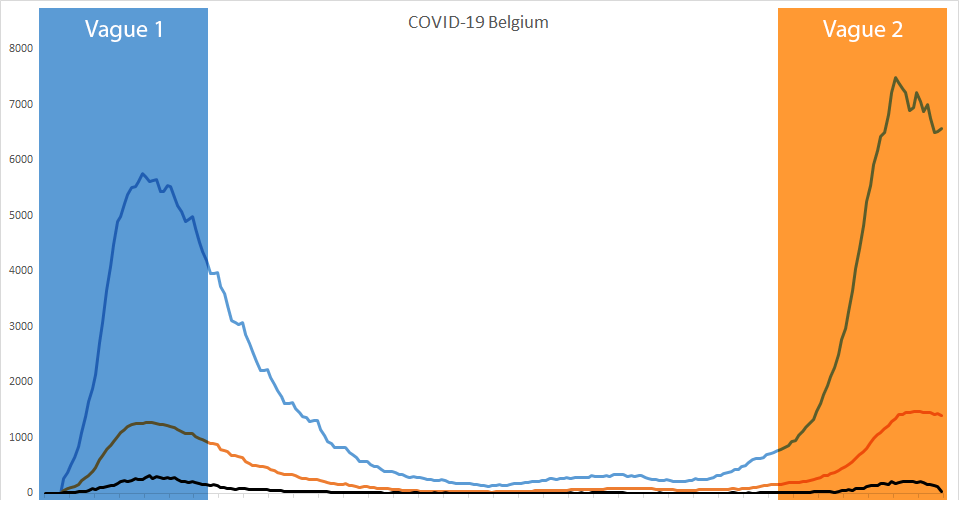
Dans le graphique ci-dessous, la vague du printemps 2020 est encadrée en bleu et la vague de l’automne 2020 en orange:
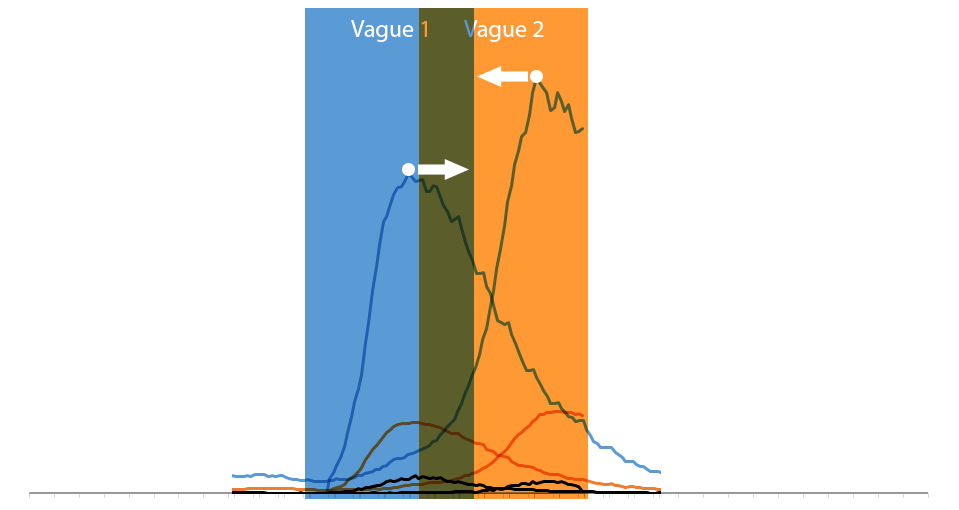
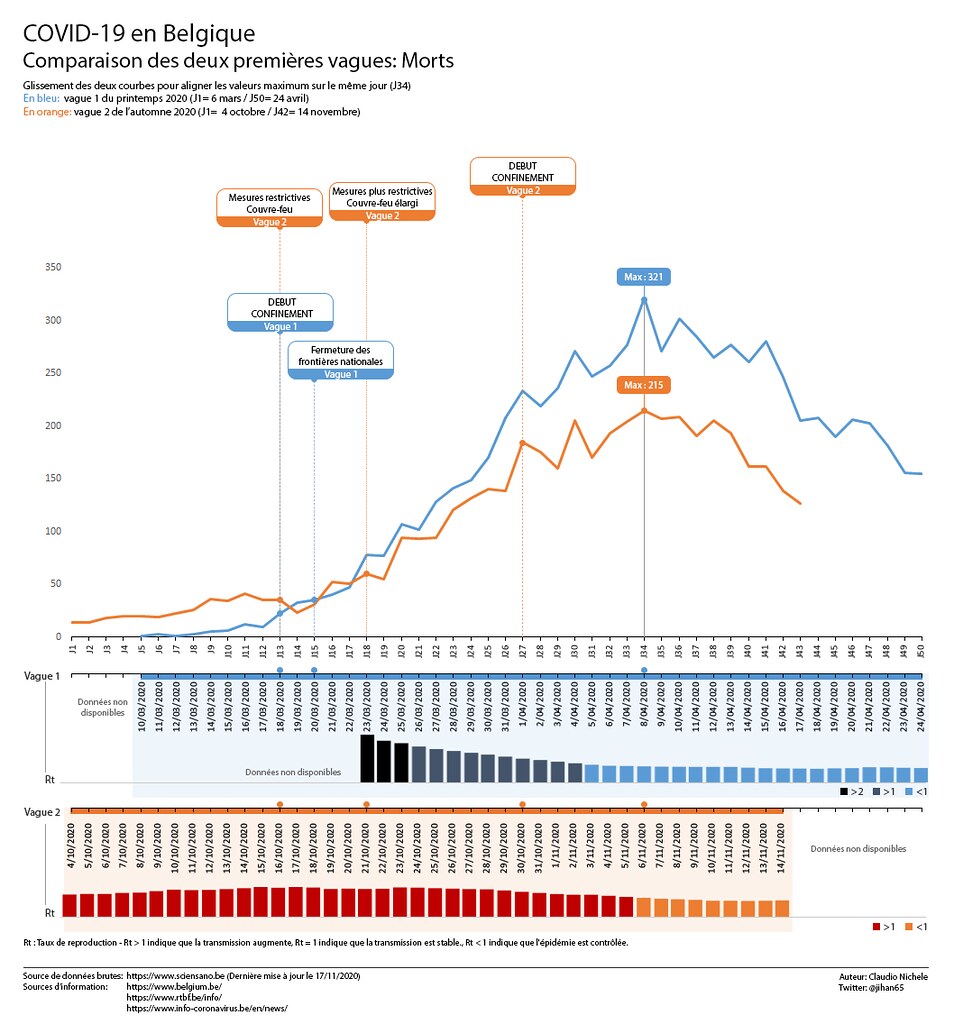
J’ai ensuite rapproché les courbes en les faisant glisser sur l’axe horizontal jusqu’à ce que leurs sommets (= la valeur max de chaque vague) tombent le même jour:
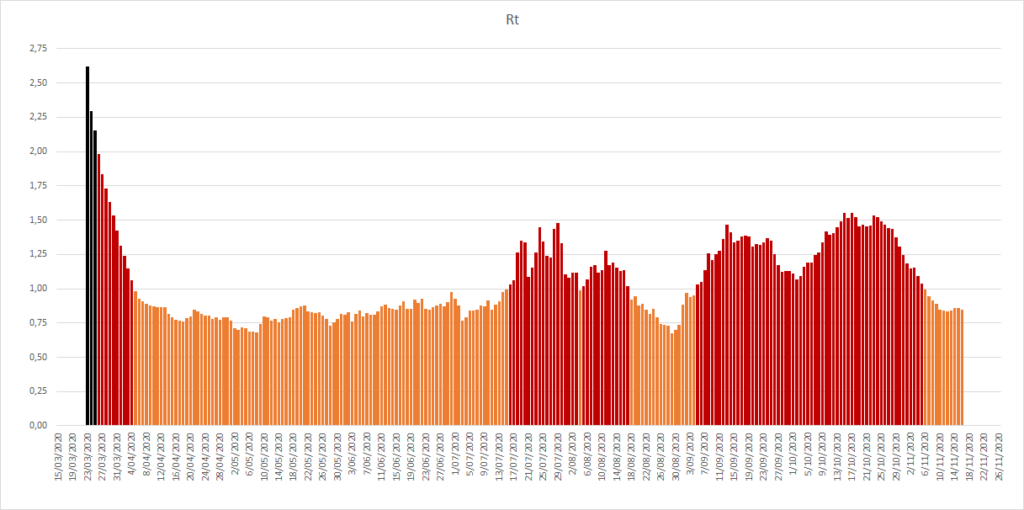
J’ai aussi ajouté le taux de reproduction, Rt (ou R0), sous les graphiques des 3 indicateurs. Sur la ligne du temps ci-dessous, la couleur orange (la plus claire) indique un Rt inférieur à 1, la couleur rouge indique un Rt supérieur à 1, la couleur noire (la plus foncée) indique un Rt supérieur à 2. J’ai utilisé la tonalité, de clair à foncé, pour le RT dans les graphiques de comparaison des courbes.
Comparaison des deux vagues
Voici les visualisations qui comparent les deux vagues de printemps et de l’automne 2020 pour 1) le nombre d’admissions à l’hôpital, 2) le nombre de patients en soins intensifs, et 3) le nombre de morts. Les courbes ont leurs sommets alignés sur le même jour et les décisions de mesures importantes sont situées à leur date respective selon la vague.
1. Comparaison des admissions à l’hôpital
Cliquez l’image pour pouvoir l’agrandir ou la décharger à partir de ma gallerie Flickr.
2. Comparaison des patients en soins intensifs
Cliquez l’image pour pouvoir l’agrandir ou la décharger à partir de ma gallerie Flickr.
3. Comparaison des morts
Cliquez l’image pour pouvoir l’agrandir ou la décharger à partir de ma gallerie Flickr.
Conclusions (qui n’engagent que moi):
Je dis BRAVO, chapeau bas, respect, au personnel médical en hôpital, aux professionnels de la santé et au personnel des maisons de repos. Moins de personnes sont décédées par jour grâce à eux lors de la deuxième vague. Ils l’ont fait malgré la fatigue, le stress, la peur, et le manque de resources, alors qu’ils ont eu plus de patients à traiter que pendant la première vague. Je ne suis pas expert, mais mon explication simpliste est qu’ils ont appris les leçons de la première vague. Ils ont développé et amélioré leurs protocoles afin de mieux combattre le virus. Merci infiniment à Vous tous!
Je ne dis PAS BRAVO au monde politique belge. Ni à l’actuel qui a dû gérer la crise sanitaire, ni aux précédentes générations de politiciens qui nous ont légué ce système institutionnel et décisionnel. La complexité du système a donné lieu à une belle cacophonie pour communiquer les décisions anti-covid.
« il manque des structures claires [dans le système de santé belge] où on sait qui est responsable pour quoi. Le système belge a aussi contribué à la 2ème vague. » – JanDeMaessener, Professeur émérite de médecine de famille à l’université de Gand [3].
Sans parler de la communication confuse des mesures lors de certaines conférences de presse. Cela a non seulement contribué à éroder l’adhésion de la population aux mesures [4] mais cela a aussi augmenté la défiance à l’égard des institutions et alimenté la propagation des théories conspirationnistes [5]. Mais les décisions ont-elles été prises au moment opportun, au moins cela, pour freiner la montée des courbes? Surtout lors de la deuxième vague de l’automne? Le doute est permis quand on compare les deux vagues.
A la première vague du printemps, le virus nous a touché presque par surprise. L’inconnu et l’incertitude étaient totals et le monde politique et surtout médical ont du réagir en mode gestion de crise. Rétrospectivement, on constate que le premier confinement de la Belgique a été décidé tôt par rapport aux sommets de la vague, alors que les chiffres étaient encore relativement bas.
Après la première vague, les scientifiques ont alerté le monde politique et nous les citoyens qu’une deuxième vague allait arriver. Forts de l’expérience de la première, on aurait pu s’attendre à ne plus être pris par surprise, ni de devoir réagir en mode gestion de crise, et qu’une stratégie allait être mise en place par le politique pour mieux anticiper. Non seulement ce ne fut pas le cas, mais la situation dans les hôpitaux a été pire! Rétrospectivement, on constate que le deuxième confinement de la Belgique a été décidé très tard par rapport aux sommets de la vague, alors que les chiffres étaient déjà relativement hauts, déjà plus hauts que ceux de la première vague (sauf pour le nombre de décès qui est heureusement resté inférieur, les politiciens n’en ont pas le mérite). Même les mesures restrictives prises avant le deuxième confinement l’ont été quand les chiffres étaient déjà bien supérieurs à ceux de la première vague.
L’évolution du taux de reproduction Rt confirme également le retard des décisions qui auraient pu le faire baisser pendant la deuxième vague. La comparaison des deux vagues montre qu’il est repassé sous la valeur de 1 plus rapidement pendant la première vague que dans la deuxième alors qu’il partait de valeurs supérieures à 2.
Sources d’information:
Les datasets COVID-19 de Sciensano, l’institut scientifique de référence en épidémiologie des maladies infectieuses en Belgique: https://epistat.wiv-isp.be/covid/
There are articles that teach you things about yourself and others that explain the thoughts that you have confused in your mind. Scott Berinato’s interview with grief expert David Kessler in the Harvard Business Review (HBR) brought me both things.
Although like everyone else, I can feel anger or sadness during this global coronavirus pandemic, I feel deep inside me the need to stay as much as possible in the present moment. And surely avoid projecting myself into an improbable future due to the current uncertainty. “Anticipatory grief is also more broadly imagined futures” as David says.
David Kessler tells us how to behave to deal with grief during these exceptional times:
Find balance in the things you’re thinking: best images and worst scenarios
Let go what you can’t control
Focus on what is in your control
Breath
Stock up on compassion
Feel your feelings and they move through you
Let yourself feel the grief and keep going
Realise that nothing you’ve anticipated has happened
Think about what you feel
Name what’s inside of you
Name this a grief. “There is something powerful about naming this as grief” Kessler says.
The practice of meditation or mindfulness can greatly help us “To calm yourself, you want to come into the present.”.
David also talks about the sixth stage to grief that come after the Elisabeth Kübler-Ross’ classic five stages (denial, anger, bargaining, sadness, acceptance): meaning. He concludes by:
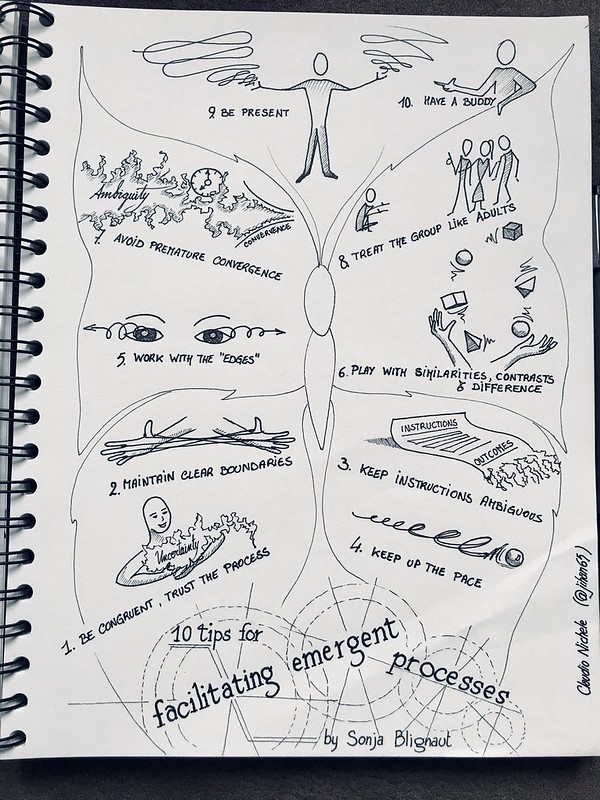
Facilitating emergent group processes requires a different kind of facilitation. When you’re not working towards a pre-determined outcome, following a pre-designed agenda, the following principles are helpful to keep in mind.
Sonja’s tips resonate with my humble little experience as facilitator of this kind of processes. She has the merit of having expressed them clearly in black on white. This is invaluable help for all practitioners who are still on their learning journey like me.
I highly recommend the Sonja’s article if you are a facilitator too, of emergent processes or not. In order to give you an overview of what it contains, here are my visual notes of it:
In this post, I explain what is a visual thinker and the benefits of using the visual approach for individuals, groups and managers. Originally, it was a document that I shared with my superiors and colleagues to help them better understand. Then I thought that everyone could benefit from it.
Update (21 May 2024): If French isn’t a problem for you, then you might enjoy listening to this podcast where I try to answer some questions about visual thinking. What is sketchnoting, visual note taking? What benefits can this visual practice bring you in a professional environment or in your private life? What does this have to do with well-being and meditation? Where to start with sketchnoting?
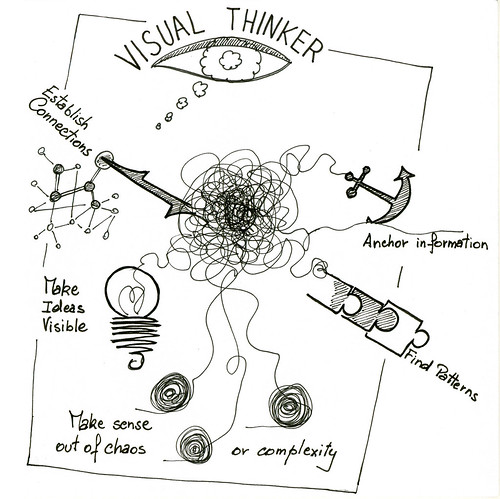
What do I mean by visual thinker?
As a visual thinker, I use a visual approach mainly during live events to allow you and your participants to anchor information, find patterns, make your ideas visible, establish connections and relationships between your ideas, and to ultimately make sense out of chaos or complexity. It also activates the emotional intelligence of people, not just the rational one. It consists mainly of combining hand-made graphic elements with texts and visual metaphors. Different techniques allow me to meet different needs and obtain different results.
What are my visual techniques?
Graphic Facilitation and Graphic Co-creation
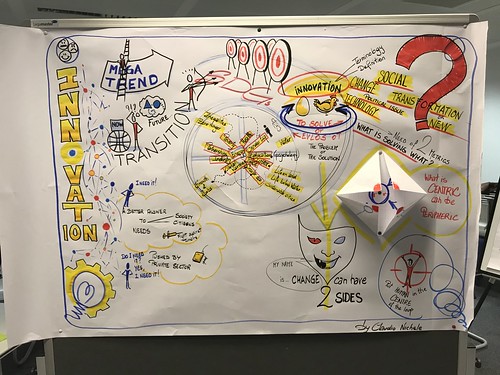
I use Graphic Facilitation and Graphic Co-creation as thinking tools for better discussions due to a different meeting setup. Both help people to find solutions, to innovate, to brainstorm, to reach consensus, to make decisions. Compared to the other techniques described below, the level of involvement of participants is high to very high in these two first techniques.
Example where researchers have had difficulty to agree on what is the meaning of “innovation”. Thanks to the visual elements they created with me on the paper they were able to “see” this difficulty. This awareness allowed them to redirect their discussion in a more constructive and clear way:
Example of using a hand-made visual template (also called canvas or harvesting sheet) to put participants in a different mental state and mood, conducive to better conversations and exchanges:
I use Graphic Recording to visually capture live the main message of conferences, meetings, or training. This helps participants to “see” their thoughts, to consider the topic being presented and discussed from another angle, and to better retain information and learning. Depending on the circumstances, I work on a large mural or on flip-charts.
The use of sketchnotes is quite similar to graphic recording in the sense that I also visually capture live what happens during an event. The difference lies in the paper size which is that of my notebook. Here participants don’t see my visuals directly (unless a camera projects my work on a big screen). I also use sketchnotes on many other occasions “just for me”, at work and at home. Whether it’s to organise my thoughts, to sketch a work planning or a process, for a to-do list or a grocery list, to plan my vacation, etc. Anyone can benefit from the practice of sketchnotes, and I guide those who wish during small learning sessions.
Visual communication
I use Visual Communication with hand-drawn illustrations to attract people’s attention incredibly. It gives more impact to your message, which is better understood and memorised by your audience. This is the technique with the lowest involvement level of the participants.
Example of visual communication with the story of the EC’s DG HR represented as a river. The handmade visual supported the Director-General’s speech and captured the attention of her audience.
Visuals as a Working tool
On a smaller scale, I use visuals in my daily routine as a working tool to offer more efficiency to my colleagues. It helps to clearly represent complex processes, workflows, etc; to capture, modelize and structure association of ideas, also for problem solving and project management.
What are the benefits of visual thinking?
I’m not going to review the benefits that neuroscience has long proven with hand-drawn visuals. I will simply mention the benefits that come from my direct and personal experience.
Benefits for an individual (at least for me)
I grasp complexity better than reading a linear text
It stimulates my imagination and creativity
It helps me better retain information and learning
I am more present and focused
It’s a pathway to heightened my self-awareness, my understanding of others, and have a deeper connection with the world around me. It opens my mind to other perspectives
It’s a source of well-being and a meditation channel
I have more fun working on serious, tedious, complex topics
Benefits for a group or a team
Visual thinking brings a new energy to the room that boosts collaboration and engagement (people realise this is not an ordinary event)
The large format graphic helps participants to work together more
effectively because:
they can “see” their ideas and what others are saying too
everyone can contribute, feel heard
the process and its progress is visible
The large format graphic creates also a neutral space that encourages
the debate about ideas while it reduces interpersonal conflicts
It helps the participants stay focused on the discussion (less distracted)
An individual can isolate himself from the group and
think in front of the large format graphic
It brings more clarity and less ambiguity
It generates collective and emotional intelligence by unlocking collective creativity
It improves collective understanding of concepts and sharing of agreements. The group can get on the same page
It transcends language barriers, eases conflicts, and dispels misunderstandings
It allows to achieve emotional and deeply relevant results
The meeting report is created on the go.
It will hold the participants accountable for what they have said and
decided
It will help them to remember and share their work with others
Benefits for managers and the organisation
Visual thinking is a powerful and effective tool
It gives the image of a modern and positive leadership
It contributes to better decision making and better shared decision making, both achieved much more effectively
It enables to tap into the collective, creative and emotional intelligences of a group in order to:
Deal with complex issues
Collect information to make informed decisions
Meetings are with fewer interpersonal conflicts and more debate about ideas
It leads to greater buy-in for visions, strategies, actions plans, decisions; to better commitment to these and better appropriation for a sustainable change
It generates greater accountability for what is said and decided
It denotes a transparent communication
It materialises the recognition to individual contributions and group consensus
It leads to more motivated teams
It brings fun into otherwise boring jobs, tasks, and meetings
Some years ago, Robert Madelin was appointed Director-General of DG INFSO and he requested major changes in the way the DG ran its intranet. To explain to him that we didn’t have enough time to apply all of them, given our available resources, I made our case to him with a quickly sketched story on paper, instead of a Powerpoint and Excel figures. Robert accepted our proposition because I was disruptive. I approached him with unconventional thinking. When I went to his office with a drawing, he said, ‘Oh my God, what is that?’ And when he looked closely, it helped him think differently about the problem. This for me was the opportunity to make my case and he accepted my explanation.
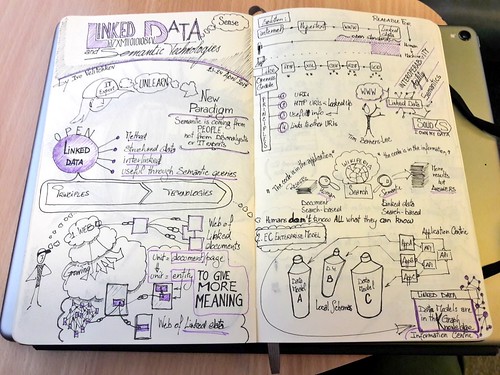
Recently I had the privilege of attending a course on Linked Data and Semantic technologies. It was a 2-day intensive course given by a brilliant Ivo Velitchkov to people working in the European institutions.
I cannot yet say that technologies like RDF, SPARQL, OWL or SHACL have now no secrets for me, far from it. At least I better understand their potential and possible applications. Especially now that I had the opportunity to deepen these technologies with the help of Kingsley and Margaret on social media. This is what I will share with you here below.
Of course, everything started with sketchnotes. Because I couldn’t help but take visual notes during the two days of the course.
Someone asked me if I drew these notes after the class, after having put my thoughts and ideas in order. Well not at all! First because I don’t have time after. Rather because taking visual notes live is my best way to understand what is said during the course, to assimilate and to remember later.
I usually publish my work, whether drawings or photos, on the Flickr platform. So I published this series of visual notes in a dedicated Flickr album that I tweeted.
On Twitter, I was quickly asked by Kingsley Uyi Idehen for the URL/URI per image. Kingsley was unknown to me until then.
Gosh…. I was forced to put into practice the concepts learned during the course!
The Uniform Resource Identifier (URI) is the string of characters that unambiguously identifies a particular resource. The RDF Triple, or semantic triple, is the atomic data entity in the RDF data model that codifies a statement about semantic data in the form of subject–predicate–object expressions (e.g. “this image is sketchnotes”, or “this image depicts semantic web”).
Aussitôt dit, aussitôt fait! Enfin presque! (No sooner said than done! Well almost!)
ImageSnippets is a complete metadata editing interface that enables someone who knows little to nothing about RDF, OWL, ontologies, or even URIs to create descriptions for images using Linked Data (also known as structured data) which is written in RDF.
I took the challenge and added my images on the platform. I also had fun to enrich them with meta-data, RDF triples and annotations. This was a great exercise after the Ivo’ course where I put into practice what I had learned. Margaret was also unknown to me until then.
I’m proud to give you here the URI of my images on imagesnippets.com :
Resolution: 775×623
Resolution: 775×626
Resolution: 775×621
Resolution: 775×623
Resolution: 775×623
Check out these gorgeous sketchnotes about linked data shared *with* linked data annotations shared from #Imagesnippets! Click on the links and flip the images for more info created by @jihan65 on these images. Really nice! https://t.co/63yQLIz1VJ
Like me, you can ask what is the added value of publishing photos, or pictures, on a RDF platform such as imagesnippets.com rather than on a platform like Flickr entirely dedicated to photos.
If your goal is to organize, retrieve and look at your photos, then Flickr does the trick. If your goal is to share your photos with friends and people with the same interests as you, eventually to comment and like, then again Flickr does the trick.
But if the final goal is that your images can be semantically connected to related content on the web – be it words, paragraphs, documents, other images, people or objects – then the “RDF” approach is required. For this to be possible, your images must become nodes of the graph of Linked Data. This way both humans and machines can find them and link them to other pieces of information on the web. What I did on imagesnippets.com.
Having content, like your images, semantically connected on the so-called Semantic Web will help to create and make more sense (to current chaotic web). Is it not a noble cause to change the messy web where the search results don’t provide real answers to the questions, to a place where answers make sense?
Linked Data and the Semantic Web have of course other benefits. You can find out more by watching the first 13 minutes of this webinar :
Check out Kingsley’s thread on Twitter to see all of that in action (from a human perspective, which is not equal to the machine one):
We now have the following docs and #LinkedData exploration launch-points:
Thank you Ivo for your support, your help to review the text, and your suggestions.
Thank you Margaret and Kingsley for these great interactions for the benefit of my understanding of the semantic web! I hope this post will help others to better understand it too.
Que vous inspire le nombre 12?
Les douze coups de minuit? Peut-être un nombre sublime en mathématiques? (peut-être pas, désolé, j’aime bien les maths). Peut-être pensez-vous au nombre de signes du zodiaque, d’étoiles sur le drapeau Européen, de disciples de Jesus, de syllabes pour un alexandrin, de côtes dans votre corps, de travaux d’Hercules? Laissez courir votre pensée autour de ce nombre. Divaguez dans les mythes et les religions où il revient souvent.
Douze, c’est aussi et plus simplement, le nombre de mois dans une année. Eh ben, me direz-vous, toute cette diversion pour en arriver à cette banalité? Oui, car j’avais besoin que votre imagination s’évade en pensant au nombre douze, afin de mieux comprendre ce qui suit.
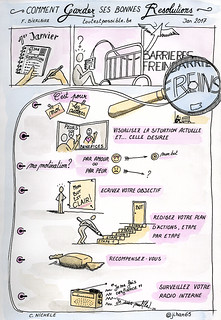
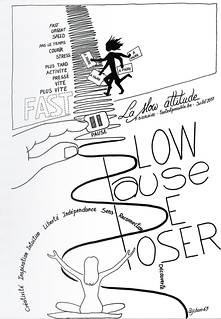
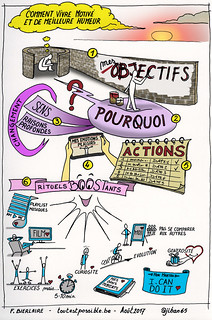
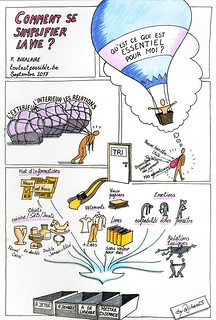
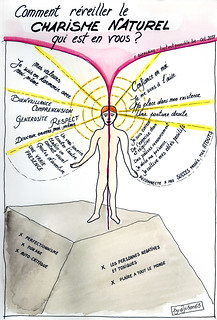
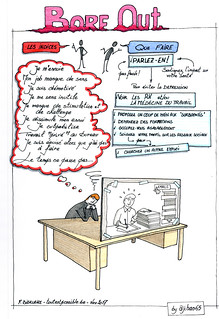
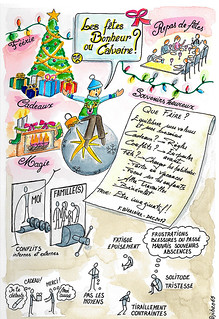
Ca fait un an, donc douze mois, que j’ai accepté de collaborer au blog toutestpossible.be de mon amie Florence Bierlaire en illustrant ses billets mensuels. Chaque mois, Florence m’envoit le texte de son prochain billet et elle me laisse carte blanche pour l’illustrer.
La confiance aveugle de Florence me rempli d’une joie immense car elle est le signe d’un respect, d’une reconnaissance et d’une grande amitié entre nous deux. Cette relation privilégiée fertilise le terrain où mon inspiration et ma créativité peuvent s’exprimer librement.
Liberté, certes, mais comme toute liberté il faut l’assumer. C’est pour moi un défi chaque mois. J’ai le trac quand je reçois l’email de Florence qui contient le texte de son nouveau billet à illustrer. De quel sujet s’agit-il? Vais-je en comprendre le sens? Serais-je inspiré pour l’illustrer? Trouverais-je un language visuel que les lecteurs de Florence comprendrons? Qui soit respectueux du sujet, de Florence la psy, de Florence mon amie et surtout de ses lecteurs? Autant de questions, et d’autres encore, qui reviennent chaque mois.
Mes inquiétudes laissent toutefois rapidement place à l’appétit et à l’excitation.
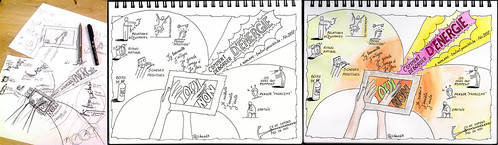
J’entre alors dans le texte, un nouvel espace à découvrir, un autre renard à apprivoiser, une nouvelle semence à planter. Mon procédé est pratiquement toujours le même: lire le texte, comprendre, relire, ne pas interpréter, rester dans ce qui est dit, digérer, attendre, laisser reposer, relire ça et là le texte, le butiner, garder en mémoire ou esquisser mes idées visuelles, surtout les premières qui s’avèreront souvent être les meilleures, surligner dans le texte les mots ou les phrases qui me marquent, croquer au crayon les liens mentaux entre ces idées fortes. Puis, faire le point lentement. Décanter. Méditer sur les mots, les idées, les visuels, les connexions, les couleurs, mes émotions, mes ressentis.
A la fin vient mon carnet de dessin où j’y agence mes idées en traits de crayon d’abord, en courbes, en couleurs et en ombres ensuite. Parfois simplement en noir et blanc.
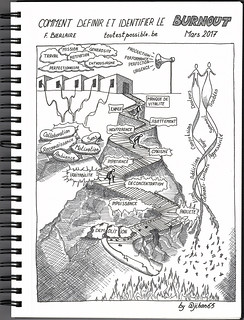
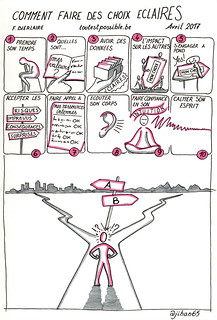
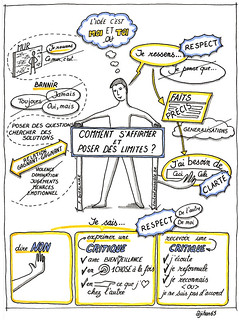
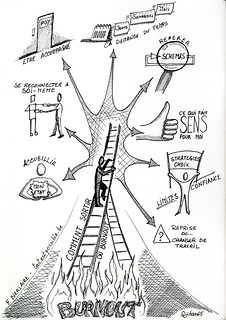
Voici les 12 illustrations de l’année 2017. Vous pouvez cliquer les images pour les agrandir et le lien en dessous pour lire l’article dans son entièreté:
Illustrer les billets de Florence qui traitent de psychologie ne fut pas chose aisée, même si l’humain et ses relations avec les autres et avec lui-même sont un domaine que j’apprécie particulièrement. Je constate, outre l’aspect purement technique du dessin, que cela m’a demandé de la concentration pour bien comprendre ce qui est dit, et juste ce qui est dit, sans extrapoler. Une juste balance entre la méditation nécessaire pour digérer le sujet et … laisser courir mon imagination autour de ce dernier. C’est cet équilibre qui aura représenté la plus grande difficulté. M’en tenir au sujet mais imaginer loin comment le visualiser.
Les douzes articles de 2017 auront été un défi où, à chaque mois, j’aurais appris quelque chose. Ce fut avant tout une très belle expérience humaine entre Florence et moi. Je suis sûr qu’elle va grandir encore lors de cette nouvelle année (retrouvez les nouvelles illustrations dans mon album Flickr). Cette collaboration m’a aussi et surtout aidé à progresser dans ma pratique de l’illustration, dans celle de la lecture attentive ainsi que dans mes autres activités où j’utilise le language visuel.