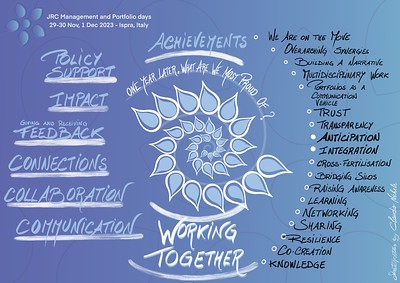
Graphic recording of the JRC senior management seminar

As member of the JRC and as visual thinker, I was invited to capture visually the main insights of the JRC senior management seminar. During two days, I listened to a few hundred managers taking stock after one year of the launch of an innovative way of working in transversal modes in our organisation, the so-called JRC portfolios. The program was a fair balance between keynotes, informative presentations, exchanges, and conversations in world café mode. My challenge was to create the graphic recording of all this in order to provide a visual but also emotional memory that would be useful to the participants and those who were not present.

Graphic recording of the JRC senior management seminar

On the substance

Overall, the results after one year are positive. There is a deeper understanding among the managers of the benefits of collaborating and working together on cross-cutting themes to “do even better science to support EU policies”. There are of course issues to resolve, while navigating a complex organisation and world, but by working together, everyone agreed that we would be able to overcome it all.
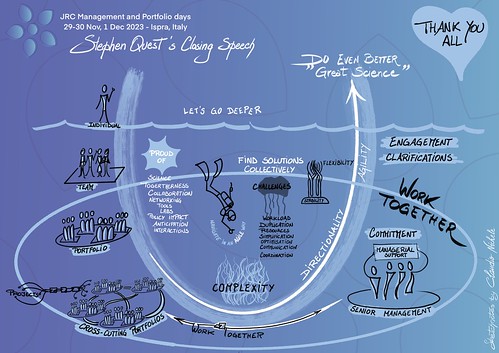
Graphic recording of the JRC senior management seminar

How I worked

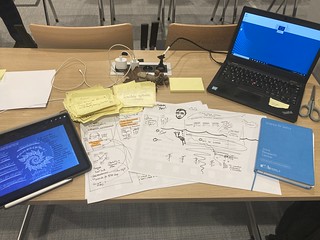
Aware that I would not have been able to capture the essence of extremely technical, dense and tense conversations over two days, I put together a small team of volunteers to help me. They were instructed to write down points and insights that were important to them on post-its (when they wanted and if they could) and bring them to me. This is how dozens of post-its arrived at me at the end of each intervention. Thanks to them I was able to refine my live visual notes by confirming or correcting my own notes, or by covering what I had missed.
Graphic recording of the JRC senior management seminar Graphic recording of the JRC senior management seminar

Personal take-aways

The intensity of the program spread over three days, and the exhausting trips to and from the hotel which was very far away, should not have impacted my concentration and my ability to listen. So I relied on a few small moments of meditation during the days, whether it’s a walk outside the conference center or stacking stones in balance inside. This is really what allowed me to keep my concentration and manage my mental fatigue.

Graphic recording of the JRC senior management seminar

I was moved when some of the colleagues who helped me with the harvesting said at the end that they had listened to the speeches with much deeper attention than usual. They experienced the basics of harvesting, this technique in the art of hosting which first consists of listening at different levels. Without them I would not have been able to create such rich and deep visual notes. Harvesting important events can only be done correctly with and as a team.

I want to express them my gratitude and to the other colleagues with whom I had the privilege of working closely, for their support, their help, their kindness, for the coffees brought, their smiles, for their comforting looks, for who they are. Beautiful people.

Graphic recording of the JRC senior management seminar Graphic recording of the JRC senior management seminar Graphic recording of the JRC senior management seminar Graphic recording of the JRC senior management seminar

This blog post is available on Linkedin as well

Share on:

Visuals bring clarity about the complexity

My takeaway from conversations that I captured visually

Our brain has great difficulty understanding a complex system with only words. A visual can bring clarity about the complexity and eventually show that what appears to be complex is just complicated.

Over 200 colleagues from across the JRC, the European Commission’s science and knowledge department, met for the launch of their future new transversal working structures, the JRC scientific portfolios. The goal was to engage and discuss around the journey they are about to embark upon together. As with any departure, there was excitement but also some fear sometimes in the face of the unknown.

During a large World Café exercise, colleagues discussed the many outstanding issues, roles and responsibilities, collaboration, resources, to name but a few. At the end, each conversation table shared their main conclusions with everyone. The large number of points, open questions, as well as the numerous interlinkages, made it difficult not to qualify the portfolios system as complex.

My task was to take visual notes of the conclusions, the typical graphic harvesting of a World Café. Because it was too much, too dense and fast, I just noted on post-its the key words and few arrows. Afterwards I put on a large paper a first draft of all of that. Only then did I reorder the points and the connections to create a mind-map on my iPad.

In his report after the event in which he used my visuals, Stephen Quest, the JRC Director-General, said “the portfolios must not become another layer of complexity. Rather, we need to use them to help navigate our complexity.” I am happy and proud to have been able to bring clarity to this apparent complexity with my visual, and I hope I have reduced it to something only complicated.

Graphic recording at the JRC portfolios launch event

Two other graphic recordings of the presentations the day before:

Graphic recording at the JRC portfolios launch event Graphic recording at the JRC portfolios launch event

And the video to illustrate my visual thinking process in three steps: post-its > draft on large paper > mind map on iPad.

Share on:

Hosting and harvesting online VS physical

On 5 May, Amy Lenzo (*) gave an online masterclass on “Hosting and harvesting online VS physical” to the community of practitioners of the Art of Hosting at the European Commission (**). My takeaways (actually apply to any online session):

“It’s not a question of technology, it’s a question of relationships” 

  • 90% of your experience, skills, practice as organiser of physical events can be transposed into online events. Reassuring, isn’t it?
  • The quality of your presence, trust and how you hold space, are just as important online as in the physical world
  • Never host alone an online session, be part of an hosting team
  • The hosting team must consist of at least one process host and one tech host (for all technical aspects) or more for large groups
  • The use of the camera is mandatory for speakers, and highly recommended for all participants (with muted mikes)
  • To keep participants’ attention, speakers can only use the visible/audible part of their body language: their face and their voice. Then, it’s crucial to smile with the whole face and to have a catchy tone and rhythm of voice
  • Keep in mind that everything is amplified online: your voice, your unconscious bias, space and time.
Hosting and harvesting online VS physical, graphic recording

This was also my first live graphic recording using the Procreate app (***). Only a few days after installing it on my tablet (it’s crazy, I know, but I like these challenges). My first learnings to start with Procreate:

  • Many years of experience with layers on Photoshop has helped me a lot. If you’re not familiar with layers, take time to learn how they work and to play with them
  • Select your fave brushes in advance. You can waste precious time looking for what you need during a live event. Mine were Technical pen, Acrylic and Wet Acrylic, and Hard Airbrush (I still have to learn how to have them available in one click)
  • Select your fave colours in advance for the same reason as for the tools (I still have to learn how to create my colour palette in advance)
  • Know the undo/redo gestures

(*) Amy Lenzo on LinkedinTwitter

(**) At the European Commission, the Art of Hosting is called the Art of Participatory Leadership

(***) https://procreate.art/ipad

Share on:

Another happy graphic recording at the INFORM-INIO meeting

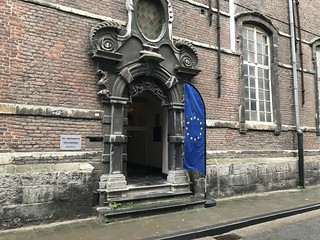
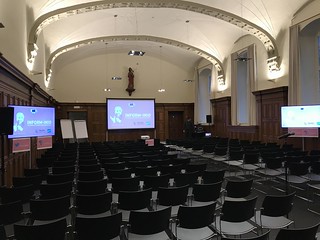
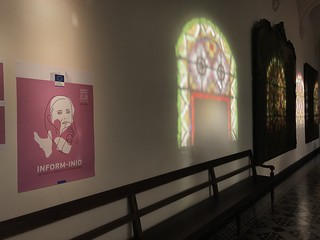
I was invited once again by my colleagues of DG REGIO, European Commission, to visually record the two-day meeting of the European funds communicators (the so-called INFORM-INIO networks). More than 250 communicators from across Europe gathered in the magnificent Augustinian cloister in Ghent, Belgium, to discuss the future of Cohesion Policy, learn and share the best practices to communicate the benefits of the EU funds to citizens.

Graphic recording of the INFORM-INIO meeting, Ghent, Belgium

I thank my colleagues for inviting me to each of the biannual meetings since 2017.

Since this first time we noticed, in the results of the after-event survey, that the graphic recording has become one of the most appreciated elements by participants. The many positive feedback I receive from them during the two days only confirm these results. It proves to me that hand-made visuals have a noticeable impact on people, combining emotions and information.

That all those who took the time to come and talk to me are also thanked.

See all my photos of the INFORM-INIO meeting and from the previous editions since 2014.

Graphic recording of the INFORM-INIO meeting, Ghent, Belgium
DEC2C3B7-F7B1-41BE-838D-FC77C68946B2


Ghent is “the most beautiful city in the world” said its mayor. Judge by yourself:

Awesome Ghent, Belgium

Read also my post at INFORM-INIO meeting in 2017.

Share on:

EU DataViz 2019

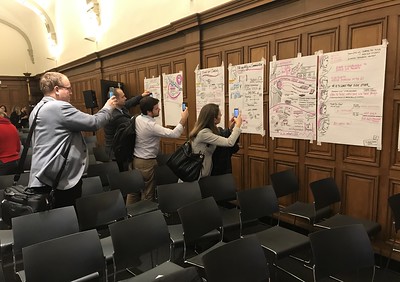
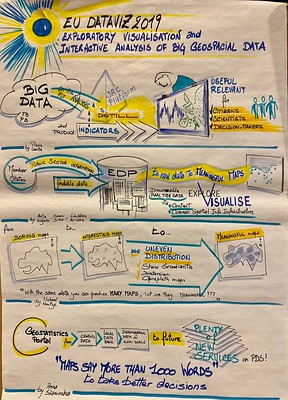
What a great experience it was to be graphic recorder at the “EU interinstitutional workshop on data visualisation” organised by Publications Office of the European Union on 13 November 2019 in Luxembourg. With Célia Pessaud, Catherine Focant, and Vincent Henin, we lively scribed the parallel sessions of the conference.

Graphic recording at EUdataviz 2019

It was exciting to visually scribe workshops and talks on data visualisation. We – graphic recorders and data visualisers – speak the same visual language, use the same visual grammar, rely on the same conviction that visuals are one of the most powerful mean to explain complex ideas. As as said to some speakers:

We find that there are many similarities between our practice of graphic recording and yours of data visualisation. If the raw data that you visualise is often – if not always – numbers, and more and more big data, for us, raw data is what is said and what is happening in the conference room. Both can be complex and be meaningless at first glance. Our common goal is then to make sense with what does not seem to have any, to offer this sense/meaning to our clients so that they can make good use of it, so that they can benefit from this knowledge unveiled with more clarity. One difference that I see between our practices is that while during the process of DataViz there is time to test and adapt the final visualisation (and it’s recommended by the speakers here), in the graphic recording process everything is done live on the spot: listening, then filtering, then summarising, then translation to the visual language. Without opportunity to test and adapt. 

To conclude

There are certainly synergies that can be established between our two communities to learn from each other’s. 

Graphic recording at EUdataviz 2019 Graphic recording at EUdataviz 2019 Graphic recording at EUdataviz 2019 Graphic recording at EUdataviz 2019

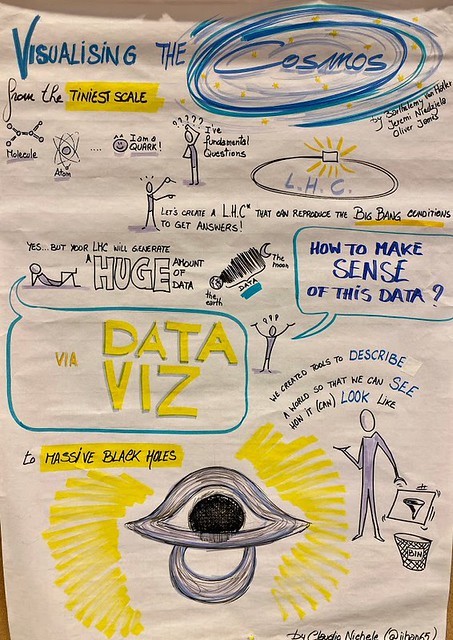
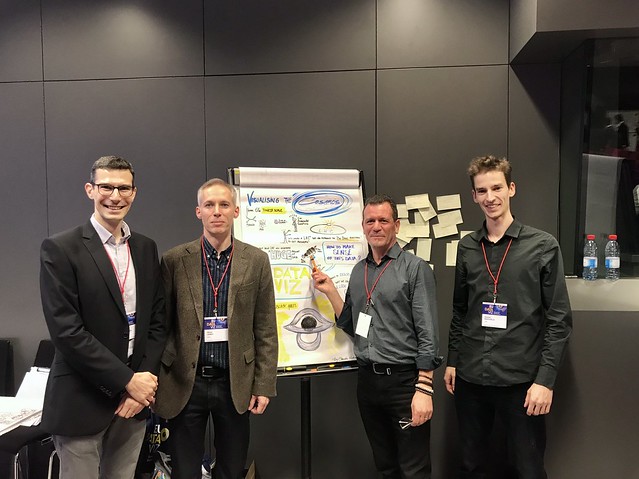
The day ended with a fascinating session on how #dataviz helps us to better “see” black holes. Big thanks to Barthélémy von Haller and Jeremi Niedziela from CERN and Oliver James from DNEG. They guided us through this wonderful journey from the smallest elements of quantum physics to the black holes and their representation in the Interstellar movie. Magnificent presentation that shows that synergies between science and art can increase our knowledge about the unknown.

Graphic recording at EUdataviz 2019 Graphic recording at EUdataviz 2019


More information about the conference with all graphic recordings of the team is available on op.europa.eu/en/web/eudataviz/home

Share on:

The power of canvasses for better conversations

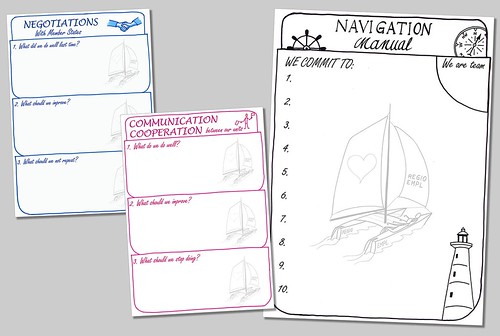
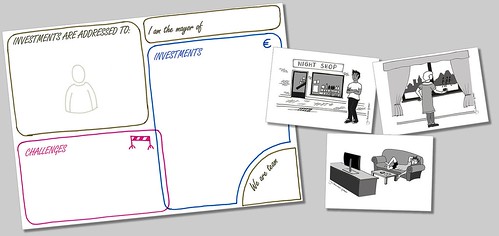
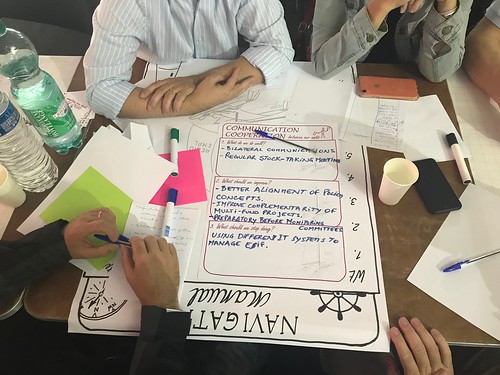
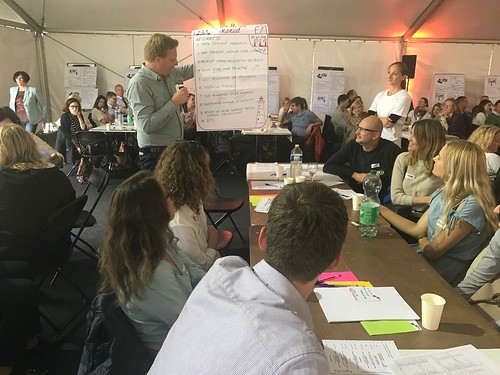
On 16/09/2019, more than 300 colleagues from DG REGIO and DG EMPL were in an away-day to reflect on “how to better navigate to the future” for beautiful operational programmes. I was asked to prepare the templates, or canvasses, to harvest the ideas and conclusions from the discussions. There is nothing better than canvasses to put participants in another mental state conducive to better conversations and exchanges.

The power of canvasses The power of canvasses The power of canvasses The power of canvasses

I was not asked for that, but I can not help but capturing the essence of the day with visuals. Inspired by the energy in the room, a tent to be exact, I mixed sketchnotes and scrapbooking.

Graphic recording of the REGIO-EMPL geographical officers away day
Share on: